Acid-Base CLinIMApp™
(Acid-Base Computer-Linked Interactive Mapping Application)
Verify the data contained in arterial blood gas (ABG) report by keying in the PaCO2 and [HCO3-] values, supplied to you by the lab, within their respective fields on a Tri-Axial image. The app will scribe a line corresponding to each of those values, scribe another line portraying the [H+] value, and display digital readouts for [H+] and pH. The location of the point of intersection of the three scribed lines on the Tri-Axial Map will indicate what acid-base derangement, if any, applies to your patient.
Acid-Base CLinIMApp™ (Acid-Base Computer-Linked Interactive Mapping Application)
Instructions
Type in the values of PaCO2 and [HCO3-] and click Submit. Lines will be scribed on the tri-axial map below revealing the value of [H+] and showing the calculations that led to the pH value.
Showing Work Because what good is a result if you don't know how it was derived?
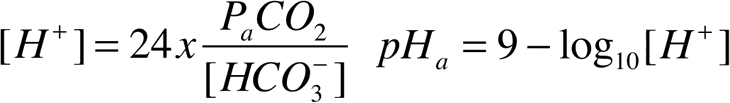
Calculation for [H+]
[H+] = 24 * ( / ) = nM/L
[H+] =
Calculation for pH
pHa = 9 - log10 = 9 - =
pHa =
Classification:
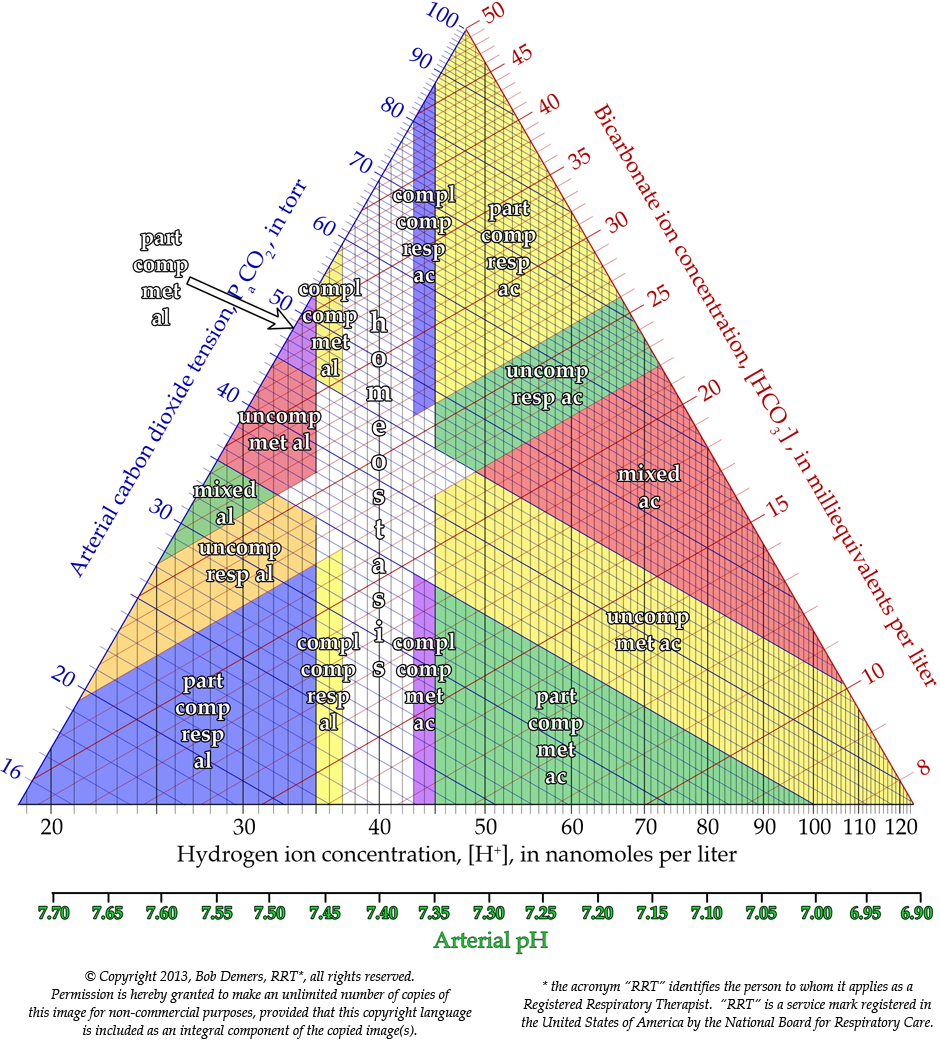
The Tri-Axial Map
Click on the label within a region to view more detailed information about its classification.
The following values for PaCO2, [HCO3-] and [H+] were considered the normal limits of their respective ranges for construction of this nomogram: 35 to 45 torr, inclusive; 22 to 26 mEq/L, inclusive; and 35 to 45 nM/L, inclusive.
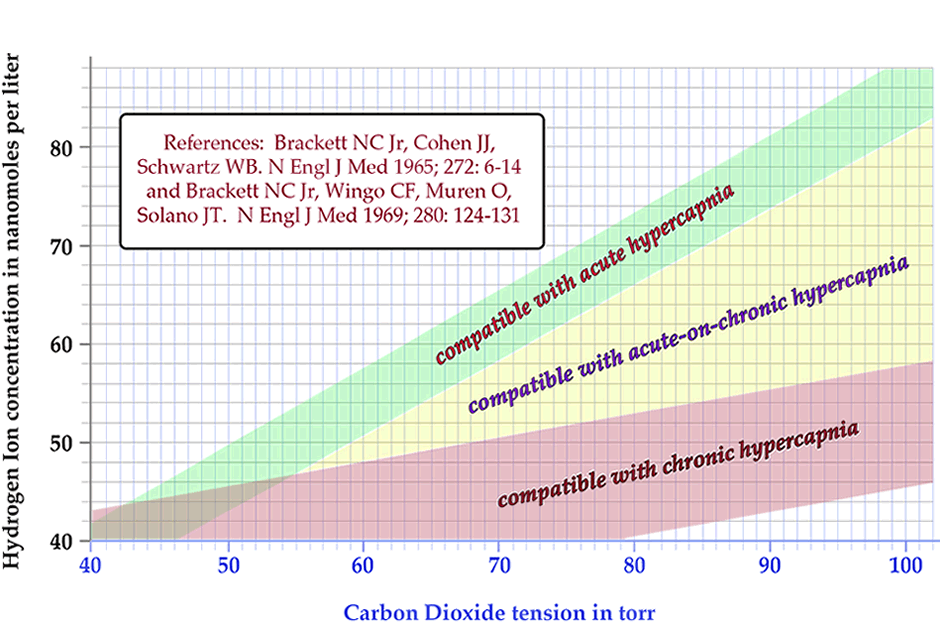
Chronicity Map The Physiometric Nomogram for Determining the Acuity/Chronicity of Hypercapnia
Mind Map
Partially Compensated Metabolic Alkalemia
The [H+} is low here (<35 nM/L): alkalemia (and the ratio is denominator driven). Click here for a detailed explanation.
The PaCO2 is high here: (compensatory) respiratory acidemia
The [HCO3-] is high here: (primary) metabolic alkalemia
Acid-base classification: partially compensated metabolic alkalemia. (Notice that the compensatory respiratory acidemia is not of a magnitude sufficient to have returned the [H+] to the normal range.)
Completely Compensated Metabolic Alkalemia
The [H+] is low-normal here (35 to 37nM/L, inclusive): completely compensated alkalemia (and the ratio is denominator-driven). Click here for a detailed explanation.
The PaCO2 is high here: (compensatory) respiratory acidemia
The [HCO3-] is high here: (primary) metabolic alkalemia
Acid-base classification: completely compensated metabolic alkalemia. (Notice that the compensatory respiratory acidemia is of a magnitude sufficient to have returned the [H+] to the normal range.)
Homeostasis
The [H+] is within normal limits here: homeostasis. (the ratio is neither numerator-driven nor denominator-driven.) Click here for a detailed explanation.
The PaCO2 is within normal limits here: respiratory homeostasis
The [HCO3-] is within normal limits here: metabolic homeostasis
Acid-base classification: homeostasis
Completely Compensated Respiratory Acidemia
The [H+] is normal here (43 to 45 nM/L, inclusive): completely compensated acidemia (and the ratio is numerator-driven). Click here for a detailed explanation.
The PaCO2 is high here: (primary) respiratory acidemia
The [HCO3-] is high here: (compensatory) metabolic alkalemia
Acid-base classification: completely compensated respiratory acidemia. (Notice that the compensatory metabolic alkalemia is of a magnitude sufficient ot have returned the [H+] to the (high-) normal range.)
Partially Compensated Respiratory Acidemia
The [H+] is high here (>45 nM/L): acidemia (and the ratio is numerator-driven). Click here for a detailed explanation.
The PaCO2 is high here: (primary) respiratory acidemia
The [HCO3-] is high here: (compensatory) metabolic alkalemia
Acid-base classification: partially compensated respiratory acidemia (Notice that the compensatory metabolic alkalemia is not of a magnitude sufficient to have returned the [H+] to the normal range).
Uncompensated Respiratory Acidemia
The [H+] is high here (>45 nM/L): acidemia (and the ratio is numerator-driven). Click here for a detailed explanation.
The PaCO2 is high here: (primary) respiratory acidemia
The [HCO3-] is within normal limits here: metabolic homeostasis
Acid-base classification: uncompensated respiratory acidemia
Mixed Acidemia
The [H+] is high here (>45 nM/L): acidemia (and the ratio is both numerator-driven and denominator-driven). Click here for a detailed explanation.
The PaCO2 is high here: (primary) respiratory acidemia
The [HCO3-] is low here: (primary) metabolic acidemia
Acid-base classification: mixed acidemia
Homeostatic Acidemia
The [H+] is highhere (>45 nM/L): acidemia (but is neither numerator-driven nor denominator-driven). Click here for a detailed explanation.
The PaCO2 is within normal limits here: respiratory homeostasis
The [HCO3-] is within normal limits here: metabolic homeostasis
Acid-base classification: homeostatic acidemia
For a discussion of this unusual acid-base condition, access the Brain Teaser monograph here.
Uncompensated Metabolic Acidemia
The [H+] is high here (>45 nM/L): acidemia (and the ratio is denominator-driven). Click here for a detailed explanation.
The PaCO2 is within normal limits here: respiratory homeostasis
The [HCO3-] is low here: (primary) metabolic acidemia
Acid-base classification: uncompensated metabolic acidemia
Partially Compensated Metabolic Acidemia
The [H+] is high here (>45 nM/L): acidemia (and the ratio is denominator-driven). Click here for a detailed explanation.
The PaCO2 is low here: (compensatory) respiratory alkalemia
The [HCO3-] is low here: (primary) metabolic acidemia
Acid-base classification: partially compensated metabolic acidemia (notice that the compensatory respiratory alkalemia is not of a magnitude sufficient to have returned the [H+] to the normal range).
Completely Compensated Metabolic Acidemia
The [H+] is high-normal here (43 to 45 nM/L, inclusive): completely compensated acidemia (and the ratio is denominator-driven). Click here for a detailed explanation.
The PaCO2 is low here: (compensatory) respiratory alkalemia
The [HCO3-] is low here: (primary) metabolic acidemia
Acid-base classification: completely compensated metabolic acidemia (notice that the compensatory respiratory alkalemia is of a magnitude sufficient ot have returned the [H+] to the normal range).
Completely Compensated Respiratory Alkalemia
The [H+] is low-normal here (35 to 37 nM/L, inclusive): completely compensated alkalemia (and the ratio is numerator-driven). Click here for a detailed explanation.
The PaCO2 is low here: (primary) respiratory alkalemia
The [HCO3-] is low here: (compensatory) metabolic acidemia
Acid-base classification: completely compensated respiratory alkalemia (notice that the compensatory metabolic acidemia is of a magnitude sufficient to have returned the [H+] to the normal range).
Partially Compensated Respiratory Alkalemia
The [H+] is low here (<35 nM/L): alkalemia (and the ratio is numerator-driven). Click here for a detailed explanation.
The PaCO2 is low here: (primary) respiratory alkalemia
The [HCO3-] is low here: (compensatory) metabolic acidemia
Acid-base classification: partially compensated respiratory alkalemia (notice that the compensatory metabolic acidemia is not of a magnitude sufficient to have returned the [H+] to the normal range).
Uncompensated Respiratory Alkalemia
The [H+] is low here (<35 nM/L): alkalemia (and the ratio is numerator-driven). Click here for a detailed explanation.
The PaCO2 is low here: (primary) respiratory alkalemia
The [HCO3-] is within normal limits here: metabolic homeostasis
Acid-base classification: uncompensated respiratory alkalemia
Homeostatic Alkalemia
The [H+] is low here (<35 nM/L): alkalemia (but is neither numerator-driven nor denominator-driven). Click here for a detailed explanation.
The PaCO2 is within normal limits here: repiratory homeostasis
The [HCO3-] is within normal limits here: metabolic homeostasis
Acid-base classification: homeostatic alkalemia
For a discussion of this unusual acid-base condition, access the Brain Teaser monograph here.
Mixed Alkalemia
The [H+] is low here (<35 nM/L): alkalemia (and the ratio is both numerator-driven and denominator-driven). Click here for a detailed explanation.
The PaCO2 is low here: (primary) respiratory alkalemia
The [HCO3-] is high here: (primary) metabolic alkalemia
Acid-base classification: mixed alkalemia
Uncompensated Metabolic Alkalemia
The [H+] is low here (<35 nM/L): alkalemia (and the ratio is denominator-driven). Click here for a detailed explanation.
The PaCO2 is within normal limits here: respiratory homeostasis
The [HCO3-] is high here: metabolic alkalemia
Acid-base classification: uncompensated metabolic alkalemia
Contact
Contact Bob Demers here: